Cybersecurity Logging Systems - C.E.S 'Crowdstrike, Elastic, Splunk'
- brencronin
- Nov 15, 2023
- 5 min read
Updated: Nov 10, 2024

In cybersecurity, various logging systems are employed, often known as 'Security Information & Event Management' (SIEM) systems when utilized by Security Operations Centers (SOCs) for monitoring security events. Three prominent logging systems in cybersecurity are CrowdStrike, Elastic, and Splunk. Splunk, the oldest among them, originated in 2003 and was most recently acquired by Cisco. Elastic, also known as Elasticsearch, is an open-source logging system storing information in JSON documents. The Crowdstrike logging system, Falcon Logscale, was acquired in 2021 from a company called Humio. Each of these logging systems possesses a distinct architectural design, and this design significantly influences how the system is designed and used for various use cases. This article aims to provide a high-level overview of the workings of each logging system.
Crowdstrike Falcon Logscale (Humio)
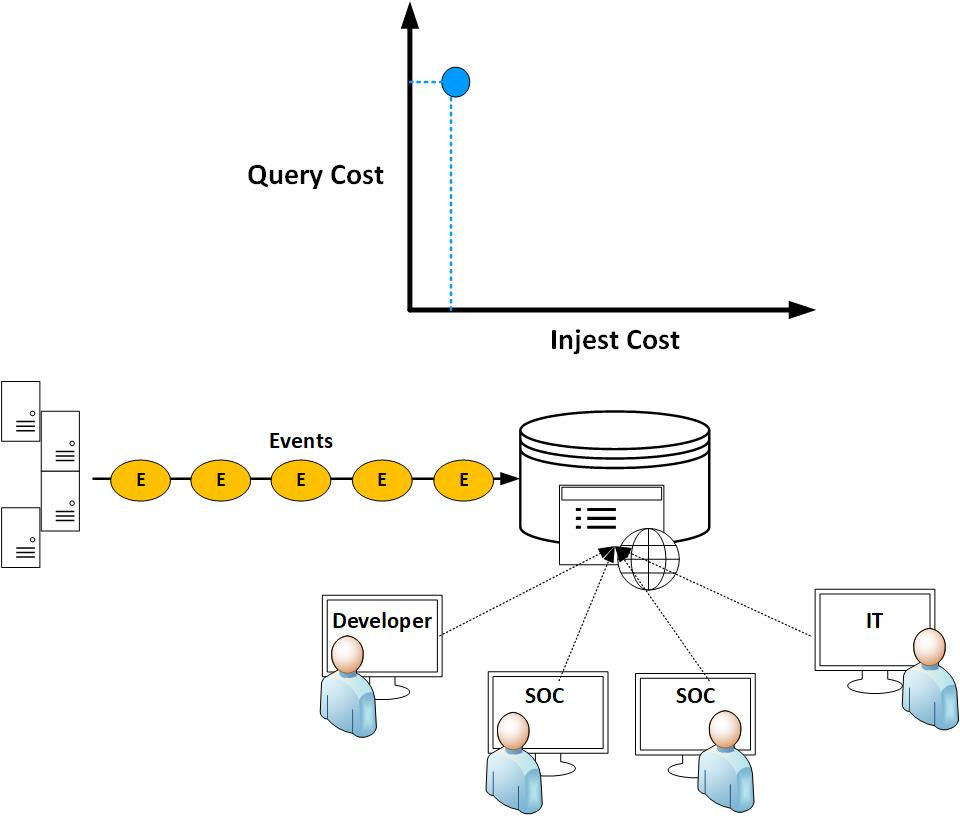
Humio introduced an innovative approach to their log management system by redefining the traditional methods used by historical log management systems. This is illustrated through a graph depicting ingest and query costs. The graph demonstrates that as the ingest process becomes more computationally intensive (for example, when indexing all of your data), the query cost decreases.

However, how are you utilizing the data? Are you frequently running queries? The diagram below illustrates a fictional ecommerce site with a database backend and thousands of users querying that backend. Ensuring a fast and efficient experience for your users is essential, justifying the additional cost of ingest (indexing) due to the resulting improvement in query performance.

Nevertheless, logging systems in most IT environments differ from ecommerce sites. They are primarily utilized by a limited number of engineers to troubleshoot systems. Is it feasible to expedite ingest, even at the expense of query speed, given the understanding that the system won't be queried as frequently? This concept is known as index-free logging.

Eliminating indexes results in reduced data storage and allows for more effective data compression, leading to increased efficiency in log storage. Humio refers to this approach as 'Mechanical Sympathy,' emphasizing the design of the logging system based on the user task rather than adapting the system to human tasks. For a deeper understanding of this concept, you can explore further details in the following link: https://www.crowdstrike.com/blog/how-humio-leverages-kafka-and-brute-force-search-to-get-blazing-fast-search-results/
Humio ingests data in compressed segments. Since all analyst log searches involve time conditions, the small "TimeStamp" (TS) field functions as a concise type of index, facilitating the search for data within the specified query to the actual segments in which it can exist.

Bloom filters are employed to efficiently ascertain whether data is present in a segment. They are particularly accurate at confirming the absence of data in a set, aiding in the elimination of segments that do not contain the queried data. For additional details, refer to the following link: https://www.crowdstrike.com/blog/how-humio-index-free-log-management-searches-1-pb-in-under-a-second/
The next efficiency concept is so straightforward that one might wonder, "why wasn't this thought of earlier?" The idea is that loading less data into memory, decompressing it, and conducting a search is faster than loading more data and searching. Consequently, the better the log data compresses, the quicker the search process becomes. You can explore this concept further in the following article: https://medium.com/humio/how-fast-can-you-grep-256ebfd5513

The final improvement of speed comes by controlling the size of the data segments and compression. This allows for data search can be performed in faster sections of the computer, such as the CPU. This is possible because the data segments are small enough to be loaded into that faster computing component.

Elasticsearch
Elastic also referred to as ELK, representing Elastic Logstash and Kibana. The core architecture of Elastic revolves around storing information in the form of JSON documents.

Elastic utilizes JSON-based files to store data within structures referred to as "indices." An index is created for a single unit of data or multiple units, known as "indices." Concerning log collection in Elastic, a distinct file within an index represents a single log. For instance, an index containing 10,000 logs would comprise 10,000 individual files, one for each log. The index serves as the largest data unit in Elasticsearch, comparable to a relational database's concept of a database. To optimize data management, information within an index is distributed across shards, which are small components forming a whole. Example document "key": "value" pairs in JSON format.

The data in Elastic can then be searched using HTTP. There are numerous methods for searching data in Elastic. The primary two types of searches include query-based searches, which match documents based on relevance to search terms, and filter-based searches, which match documents based on specific values like timestamps or IP addresses. Furthermore, the documents are stored in document indexes, which govern the data within the documents, determine where and how documents of that type are stored, and manage the lifecycle of the documents.

The process of shipping logs into a logging system is a crucial aspect of every logging system. However, for Elasticsearch, which requires data processing into indexes, the method of ingesting data into Elastic becomes a significant component of any Elastic implementation. The three primary methods for data ingestion into Elasticsearch are:
Through a Logstash processor (the 'L' in 'ELK').
Through an agent known as Beats.
By sending logs to a centralized system running the Beats agent.
Depending on the implementation, organizations may need to deploy all three mechanisms to ingest logs into their Elastic cluster.
Finally, for searching and visualizing the data, a tool called Kibana (the 'K' in 'ELK') is utilized.

Splunk
The initial step involves parsing the logs into a schema, akin to the process of normalization in database terminology. For instance, determining which field in the string represents the IP address or the date/time is essential. In the backend storage, it is imperative to allocate date/time data to a corresponding field and IP address data to an IP address field, and so on. In SIEM systems, additional metadata and fields are often appended to the original log to provide the SIEM with supplementary context for search purposes. Splunk performs this task through their 'Forwarder' agent and/or their network based 'Heavy Forwarder' agent.
Following the parsing process, there is an indexing function that facilitates more efficient searching of the data in the database. At its core, database indexing enhances the efficiency of searching through B-tree type searches, although other indexing and search methods like Bloom exist. For the sake of simplicity, B-trees are used in this explanation. Splunk utilizes an index-based backend, and a significant portion of the servers required in your Splunk implementation are commonly known as Splunk "index" servers or "indexers."
To simplify the concept of B-tree searches, consider an analogy with searching for a card in a deck of cards. If you were to randomly flip through each card, it would take an average of 26 flips. However, if you first match a suit, the average number of flips decreases to 7-9. For a more detailed explanation of the card-to-indexing analogy, you can refer to https://www.essentialsql.com/what-is-a-database-index/
The diagram below illustrates the indexing of three common log types into the logging system to enhance search speed. However, the index contributes to the log size, prompting design considerations for conserving data storage. One option involves removing the index for older data that is no longer frequently searched. If a search is required on older data, it can be conducted without the index, although this search process will take longer. Alternatively, the data can undergo a re-ingestion process to recreate the index, albeit at the cost of extended wait time for the re-ingestion process to occur.


Comments